- home
- writing samples
- photos
- spreadsheets
Spreadsheets
The team performance spreadsheet charts the performance to date of a call center team over a wide variety of performance parameters.Read more...
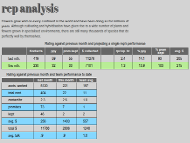
The rep analysis spreadsheet compares a rep's performance to the previous month and the team average.Read more...
- web interests
Some of my favorite links
Staying abreast of technology

MIT's Technology Review's mission is to identify important new technologies—deciphering their practical impact and revealing how they will change our lives.Read more...

Lifehacker offers tips, tricks, and downloads for getting things done.Read more...
-
contact
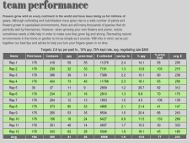
team performance
The ability to manipulate spreadsheet data enables me to do multiple analyses of team performance. It starts with developing formulae to extract data from source files (usually text files) from where I can create many different viewpoints of the results using pivot tables, macros or charts.
The following formula captures data from a text file of columnar data and adds it by columns to a spreadsheet, allowing you to extra information for several distinct teams ordered by name from an alphabetical listing of all reps in a report: =IF(ISERROR(INDEX($A$1:$AF$595,MATCH($A714,$A$1:$A$595,0),4)),0,INDEX($A$1:$AF$595,MATCH($A714,$A$1:$A$595,0),4)).
Targets: 2.8 rpc per paid hr., 15% ppy, 75% kept rate, avg. negotiating size $250 Name Contacts ppy prom kept $ collected rpc/op. hr. % ppy % prom kept avg. $ Rep 1 419 59 55 11276 2.4 14.1 93 205 Rep 2 230 32 33 7101 1.3 13.9 103 215 Rep 3 386 39 31 7389 2.2 10.1 80 238 Rep 4 404 73 46 11788 2.3 18.1 63 256 Rep 5 37 11 9 2809 1.2 29.7 82 312 Rep 6 234 23 16 2810 1.3 9.8 70 175 Rep 7 264 12 13 1803 1.5 4.5 108 139 Rep 8 373 80 33 4865 2.1 21.4 41 147 Rep 9 260 53 35 8504 1.5 20.4 66 243 Rep 10 156 18 24 6427 0.9 11.5 133 268 Rep 11 301 46 14 4657 1.7 15.3 30 333 Rep 12 343 62 28 5046 1.9 18.1 45 180 Avg. 305 41 26 6566 1.9 13.6 77 233 rep analysis
Once the text file has been manipulated and the data extracted you can analyze and split the data into several types of reports depending on need. Reports can then be co-joined to display performance relative to last month, last year, team averages or call center averages.
Rating against previous month and projecting a single rep's performance Contacts ppy prom kept $ collected rpc/op. hr. % ppy % prom kept avg. $ last mth. 419 59 55 11276 2.4 14.1 93 205 this mth. 230 32 33 7101 1.3 13.9 103 215 Rating against previous month and team performance to date last month this month team
averageaccts. worked 5120 221 197 total cont. 404 22 11 contact/hr. 2.3 2.6 1.0 promises 73 7 1 kept 46 2 2 avg. $ 256 1403 557 total $ 11788 2806 1248 avg. talk .9 .9 1.0 rep training
Good spreadsheet analysis can become a valuable training tool. Reps can be presented with daily and month-to-date reports that help them to guage their performance against company standards or their previous best performance. You can automatically highlight areas of concern and set a path for improvement as early as the end of the first week of any month.
